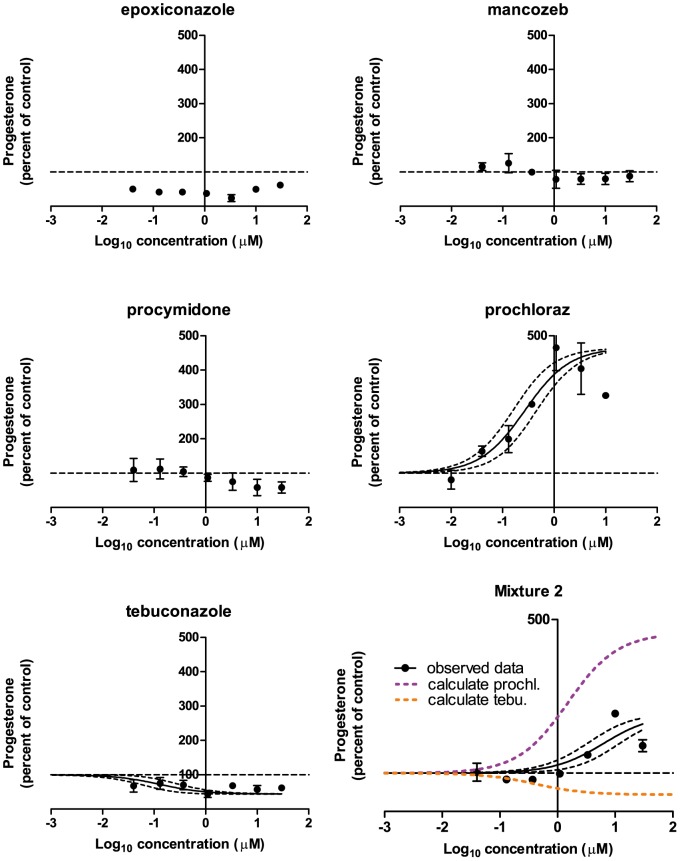
Figure 5. The effect of Mixture 2 and its constituents on progesterone levels in H295R cells.
H295R cells were incubated with chemicals or Mixture 2 in concentrations ranging from 0.04 to 30 µM for 48 h. The cell medium was next isolated and progesterone was measured by DELFIA. Data are mean ± SD. A p-value of less than 0.05 was considered significant, and in case of significance a sigmoidal curve fit (black line) was applied with a 95% confidence band (black dotted lines). The calculated contribution of each chemical is illustrated on the graph of the mixture data (abbreviated as “calculate” in the graph). This contribution is established by shifting the regression line of single chemical effects to the right along the x-axis by the reciprocal of its ratio in the mixture.

