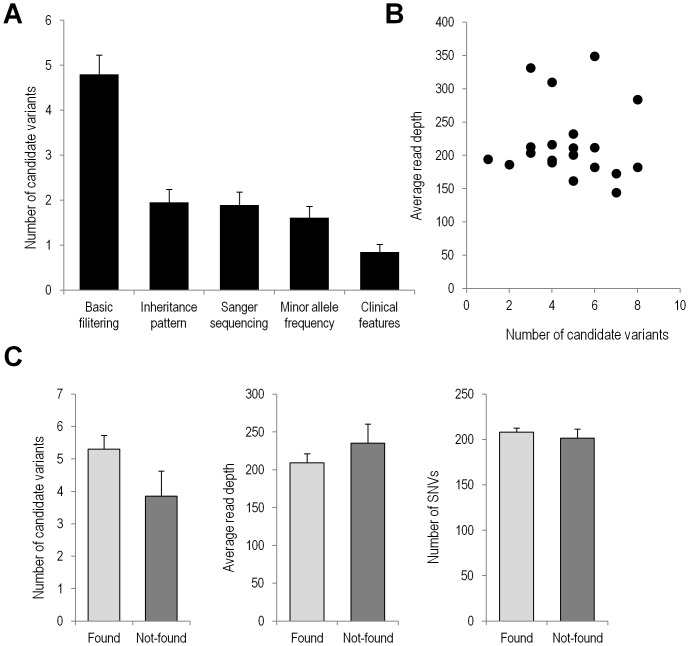
Figure 3. Interpretation of targeted resequencing in 20 probands.
(A) An average number of candidate SNVs with standard errors were shown at five filtering steps. (B) The relationship between the numbers of candidate SNVs and read depth were plotted in 20 probands. (C) Candidate SNV-found patient group (Found) was compared with patient group without candidate SNV (Not-found) in the number of candidate variants, read depth and called SNVs.

