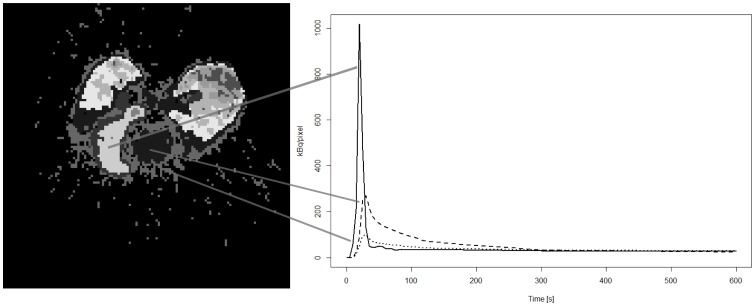
Figure 4. k-means++ result example.
Clustering results for a 13NH3 pig study using a k-means++ algorithm (k = 10). The myocardium, the right ventricle, the left ventricle, and the lungs are clearly delineated. The activity curves for some relevant regions (right ventricle, left ventricle, and myocardium; right panel) are plotted from the text file stored by jClustering after segmentation. The left image shows the last frame of the pseudo-dynamic structure generated to display the results. The value of each voxel in this image contains the cluster number that contains said voxel. Each frame before the last one displays only the voxels that belong to that cluster number.

