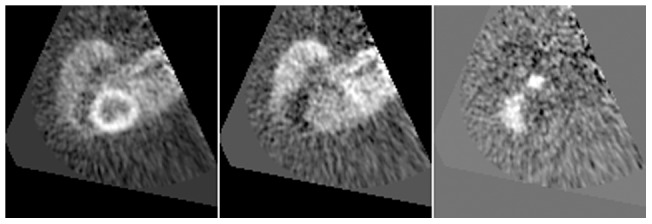
Figure 5. PCA result example showing additional images.

Three principal components resulting from applying PCA to the same study as the one used to generate Figure 4. They have been chosen to represent the myocardium (left), blood pool (center) and right ventricle (right). These images are shown during the process() method execution, prior to displaying the final clusters.
