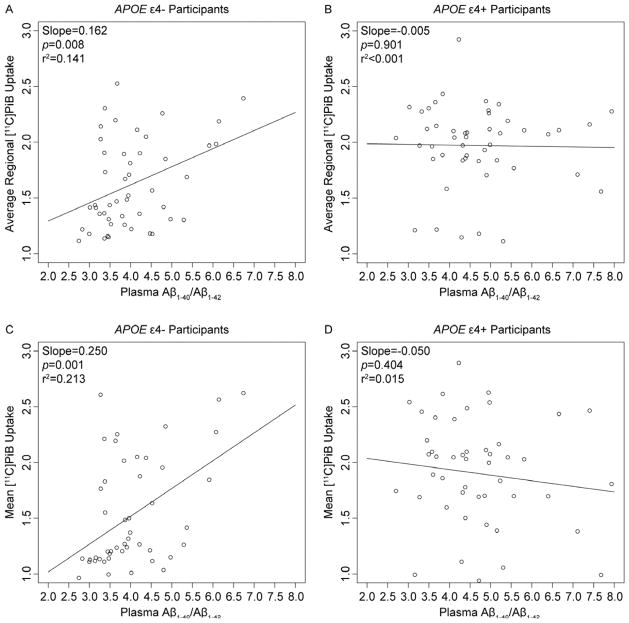
Fig. 1.
Scatter plots of plasma Aβ1-40/Aβ1-42 versus average regional [11C]PiB uptake from the (Average regional [11C]PiB uptake=Plasma Aβ1-40/Aβ1-42+APOE ε4 status+(Plasma Aβ1-40/Aβ1-42*APOE ε4 status) model (A and B), and plasma Aβ1-40/Aβ1-42 versus mean [11C]PiB uptake from the cluster identified in the (Voxel [11C]PiB uptake=Plasma Aβ1-40/Aβ1-42+APOE ε4 status+(Plasma Aβ1-40/Aβ1-42*APOE ε4 status)) model (C and D).

