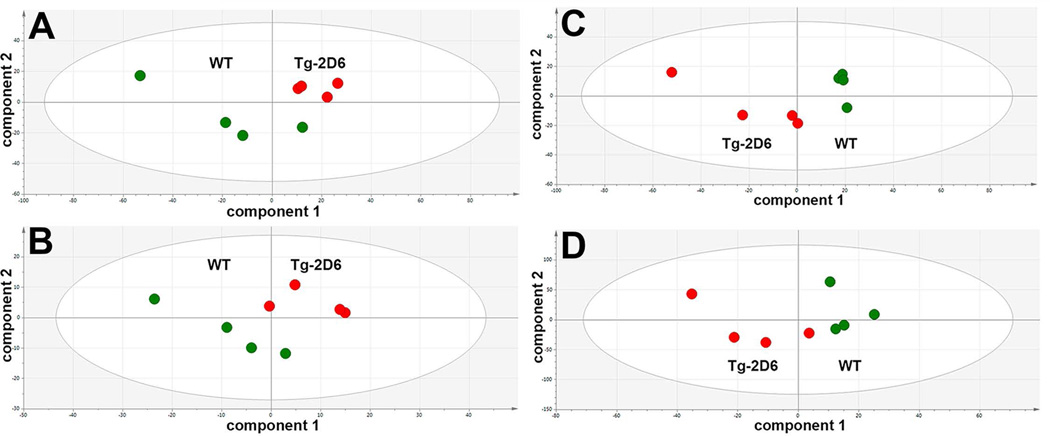
Figure 5.
Projection to latent structures-discriminant analysis (PLS-DA) scores plots for brain homogenates and cerebrospinal fluid (CSF) of male WT and Tg-2D6 mice from UPLC-ESI-QTOFMS metabolomics in electrospray positive- (ESI+) and negative-ion (ESI−) modes. Green circles represent WT mice (n=4) and red circles represent Tg-2D6 mice (n=4). (A) Brain homogenate in ESI+ mode. (B) Brain homogenate in ESI− mode. (C) CSF in ESI+ mode. (D) CSF in ESI− mode. In all cases A–D, Tg-2D6 and WT scores clustered and separated, indicating that the CYP2D6 transgene had a significant impact of both brain and CSF metabolomes.

