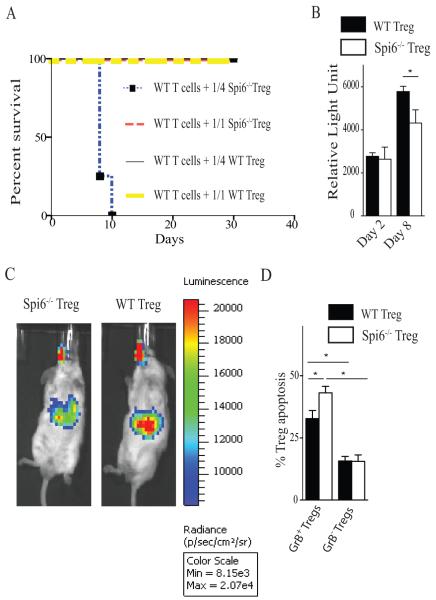
Figure 6. Spi6−/− Tregs were less potent in suppressing GVHD as compared to WT Tregs and experienced more apoptosis.
Thy1.2 WT or Spi6−/− Tregs were adoptively transferred into irradiated BALB/c mice reconstituted with 2 × 10⁶ bone marrow cells and 2 × 10⁶ T cells derived from Thy1.1 WT mice at Treg:Teff ratios of 1/1 and 1/4. (A) Graph shows percent survival of the different groups. All the mice from the different groups survived long-term except the group that received Spi6−/− Tregs at a ratio of 1/4, in which all died earlier. (B) Gluc activity measured in the blood at day 2 and 8 of the lethally irradiated BALB/c mice that received WT T cells in addition to either Gluc transduced WT or Spi6−/− Tregs. (C) Bioluminescent imaging of those mice showed a clear signal in the splenic area that is more intense in mice that received Spi6−/− Tregs compared to WT Tregs. (*p<0.05; n=3-4 mice/group). (D) Bar graph represents the percentage of apoptosis as measured by flow cytometry of the adoptively transferred Thy1.2 WT and Spi6−/− nTregs in splenocytes of recipient mice. Recipient splenocytes were gated on H-2Kb+, Thy1.2+, CD4+, FoxP3+ and GrB+ to identify the subpopulation of GrB positive (GrB+) and negative (GrB−) nTregs from Spi6−/− and WT. (*p<0.05; n=4 mice/group).

