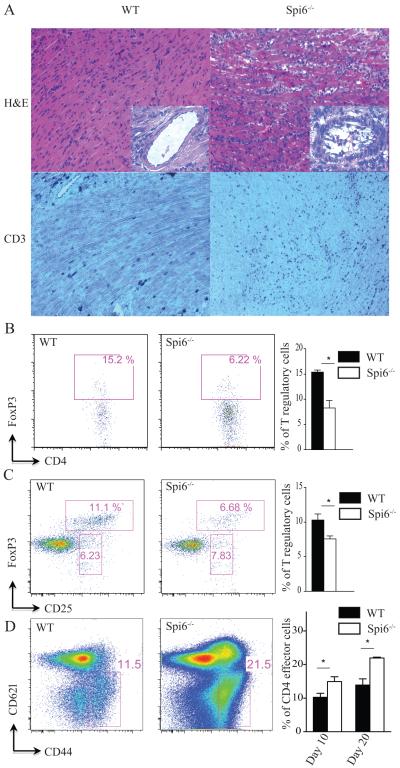
Figure 7. Lack of Spi6 accelerates rejection in a Treg-dependent MHC class-II mismatch heart transplant model.
(A) Representative examples of cardiac allograft histology at day 10 post-transplantation show higher grades of acute cellular rejection (upper panels, H&E stain, original magnification × 20), and more CD3 infiltration (lower panels, original magnification × 20) in the Spi6−/− recipients compared to WT mice (n=4 mice/group). Vasculitis was also more frequently encountered in Spi6−/− compared to WT mice (insets). (B) Representative examples of FACS staining from lymphocytes isolated from BM12 heart allografts from Spi6−/− and C57BL/6 recipients. Cells are gated on CD4 and FoxP3. Lymphocytes from heart allografts of Spi6−/− recipients had lower percentage of Tregs compared to WT. Bar graph represents the percentage of Tregs (*p<0.05; n=3-4 mice/group). (C) Representative examples of flow plots from draining LNs of Spi6−/− and WT mice recipients of BM12 hearts, gated on CD4+, CD25+ and FoxP3+. LNs from Spi6−/− recipients had lower percentage of Tregs (CD4+CD25+FoxP3+) compared to WT. Bar graph represents the percentage of Tregs in draining LN of Spi6−/− and WT mice. (* p<0.05; n=3-4 mice/group). (D) Representative examples of flow plots from spleens of Spi6−/− and WT mice recipients of BM12 hearts at day 20 post transplant, gated on CD4+, CD44high and CD62llow. Splenocytes from Spi6−/− recipients had higher percentage of effector T cells (CD4+CD44highCD62llow) compared to WT. Bar graph represents the percentage of effector T cells in splenocytes of Spi6−/− and WT mice at days 10 and 20 post transplant. (* p<0.05; n=3-4 mice/group).

