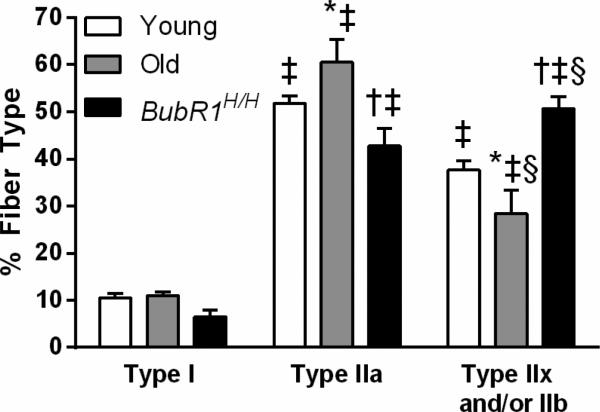
Figure 4.
The proportion of DIAm fibers by fiber type and age. Data were analyzed by two-way ANOVA (group × fiber type). Interaction post hoc results are as follows: ‡significantly different than type I fibers of the same group; §significantly different than type IIa fibers of the same group;*significantly different than young mice within the same fiber type; †significantly different than old mice within the same fiber type. n=4-9 per group.

