FIGURE 6.
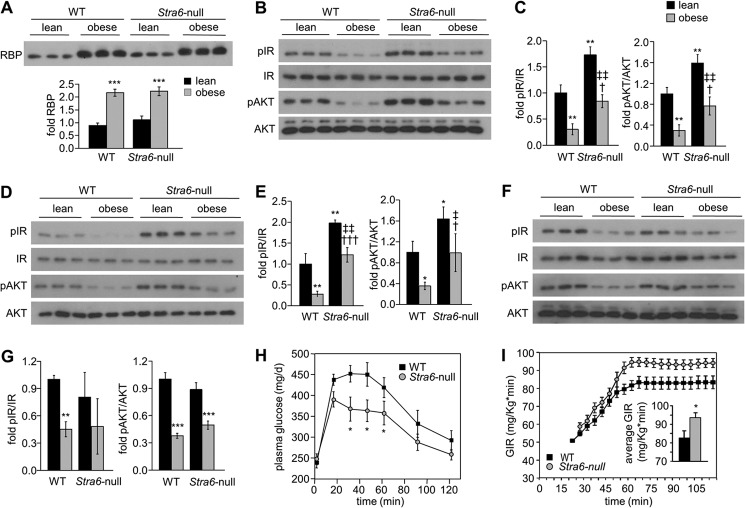
Stra6 contributes to diet-induced insulin resistance. A, immunoblots of RBP in serum of three individual WT and Stra6-null male mice fed normal chow (lean) or fed an HFHS diet for 14 weeks (obese). Mean ± S.D., ***, p < 0.001 versus lean WT mice. B, D, and F, immunoblots of pIR, IR, pAKT, and AKT in WAT (B), skeletal muscle (D), and liver (F) of three individual WT and Stra6-null male mice fed regular chow (lean) or an HFHS diet (obese) for 14 weeks. C, E, and G, quantitation of immunoblots in B, D, and F, respectively. Mean ± S.D., *, p < 0.05; **, p < 0.01, versus lean WT mice; †, p < 0.05; †††, p < 0.001 versus obese WT mice; ‡, p < 0.05; ‡‡, p < 0.01 versus obese Stra6-null mice. H, glucose tolerance test in WT (n = 11) and Stra6-null (n = 12) males following 10 weeks feeding an HFHS diet. Means ± S.E. *, p < 0.05 WT versus Stra6-null mice. The calculated area under the curve (AUC) was 45,505 mg/dl·min and 39,091 mg/dl·min for WT and Stra6-null mice, respectively. I, GIR in WT and Stra6-null mice fed an HFHSD for 10 weeks and subjected to hyperinsulinemic-euglycemic clamp. Inset, average GIR between t = 60 min and t = 120 min. Means ± S.E. (n = 9 or 10/group). *, p < 0.05 WT versus Stra6-null mice.

