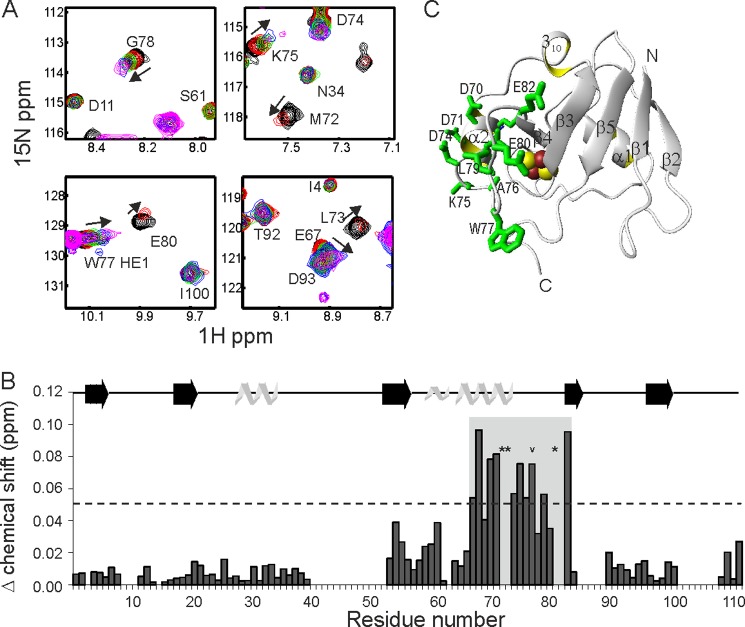
FIGURE 3.
Chemical shift mapping of the holo-Fdx surface interacting with IscS. A, representative examples of the chemical shift perturbation observed in 1H,15N-SOFAST HMQC spectra of 15N/2H-labeled holo-Fdx upon titration with IscS to 0 (black), 0.1 (red), 0.2 (green), 0.3 (blue), and 0.4 equivalents (magenta). B, the Δ chemical shift at 0.3 equivalents of IscS per holo-Fdx residue. Residues denoted by a star are broadened at 0.3 equivalents. The indole Nϵ1Hϵ1 of Trp77 is denoted with an chevron. C, mapping the interaction on the holo-Fdx surface. The side chains exhibiting the largest Δ chemical shifts as denoted by the shaded rectangle in B are explicitly shown in green.

