Figure 1.

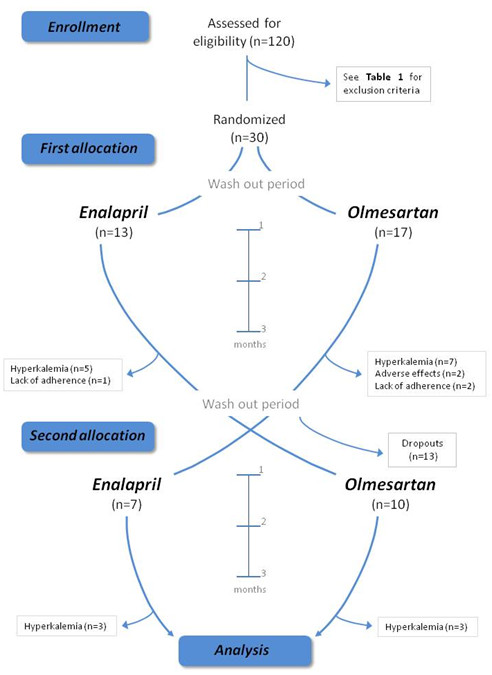
Flow diagram of participants through each stage of the trial indicating for each group the number of participants assigned that received intended treatment and were analyzed for the primary outcome.

Flow diagram of participants through each stage of the trial indicating for each group the number of participants assigned that received intended treatment and were analyzed for the primary outcome.