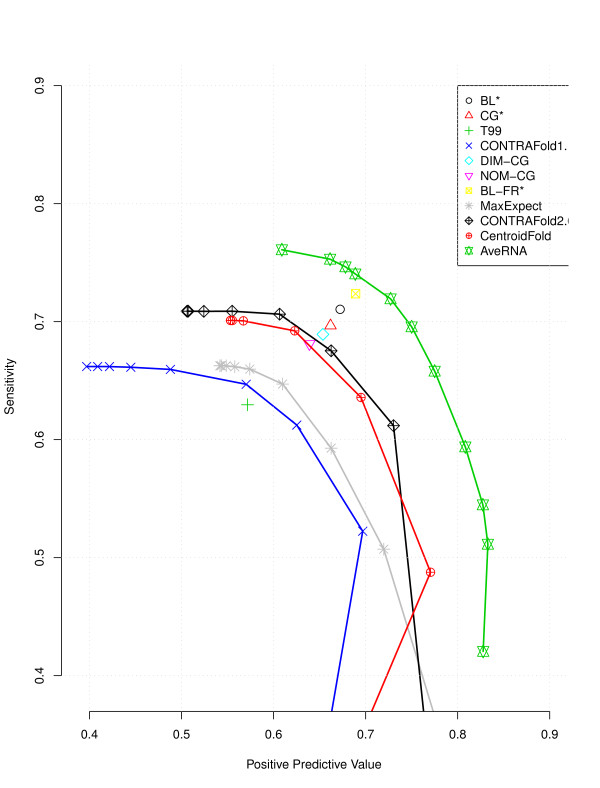
Figure 4.
Sensitivity versus PPV. Sensitivity vs positive predictive value (PPV) for different prediction algorithms; for AveRNA, the points along the curve were obtained by adjusting the pairing threshold θ, and for CONTRAfold 1.1, CONTRAfold 2.0, Centroidfold and MaxExpect by adjusting the parameter γ.

