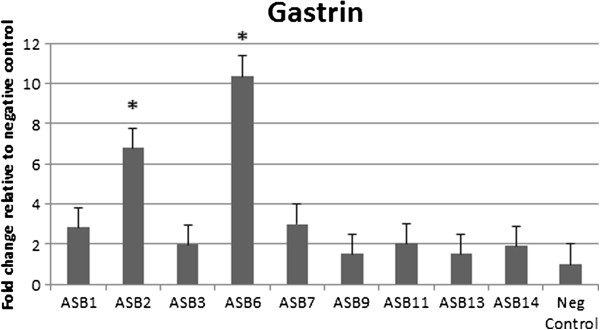
Figure 6.

mRNA expression level of gastrin in the fundus of the stomach. Gastrin mRNA expression level in the stomach was examined by quantitative RT-PCR. Shown is the expression level in the fundus. Data are presented as the fold change in gene expression normalized to 3 reference genes and relative to the negative control group which is considered as 1. Data are shown as means + standard deviation. Significant differences in expression level between inoculated groups and negative control group are indicated by * p ≤ 0.05 (Mann-Whitney U test).
