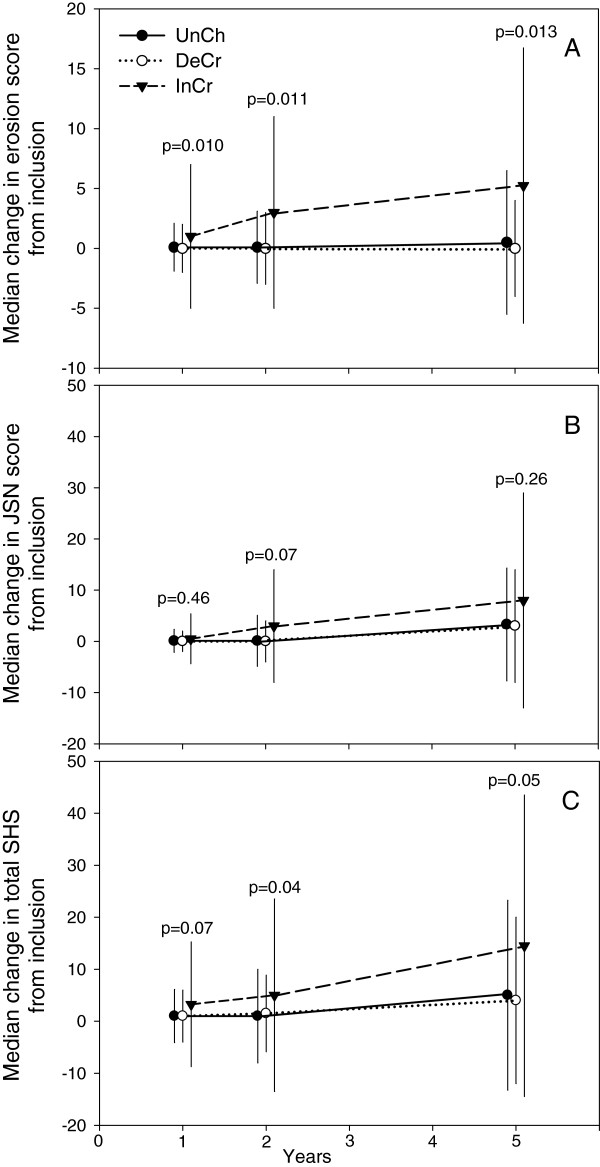
Figure 2.
Median change of erosion score (A), joint space narrowing (JSN) (B) and total Sharp van der Heijde score (SHS) (C) between inclusion and the 1, 2 and 5 year examinations. Figure 2 shows median change with 75% CI (denoted by vertical lines) of erosion score (A), joint space narrowing (JSN) (B) and total Sharp van der Heijde score (SHS) (C) between inclusion and the 1, 2 and 5 year examinations. Group UnCh, patients with unchanged serum-COMP levels from inclusion to 3 months follow-up (change ≤ 20%), Group DeCr, patients with decreasing serum-COMP levels from inclusion to 3 months follow-up (decrease > 20%) and Group InCr, patients with increasing serum-COMP levels from inclusion to 3 months follow-up (increase > 20%). P-values denote results of Kruskal-Wallis test between groups at 1, 2 and 5 years.

