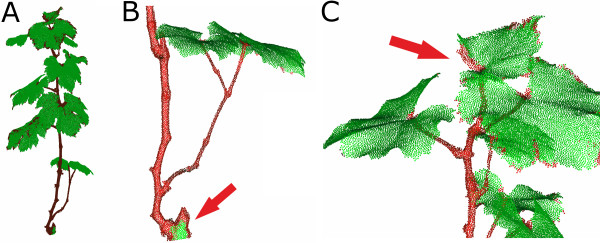
Figure 3.

Classification of grapevine leaves (green) and stems (red) (A). Misclassification appears in regions of plain stem surfaces (B) as well as at leaf borders (C), shown by red arrows. The classification was done using a normal radius of 2.5 mm and a histogram radius of 12 mm with a point cloud with 1 mm point resolution.
