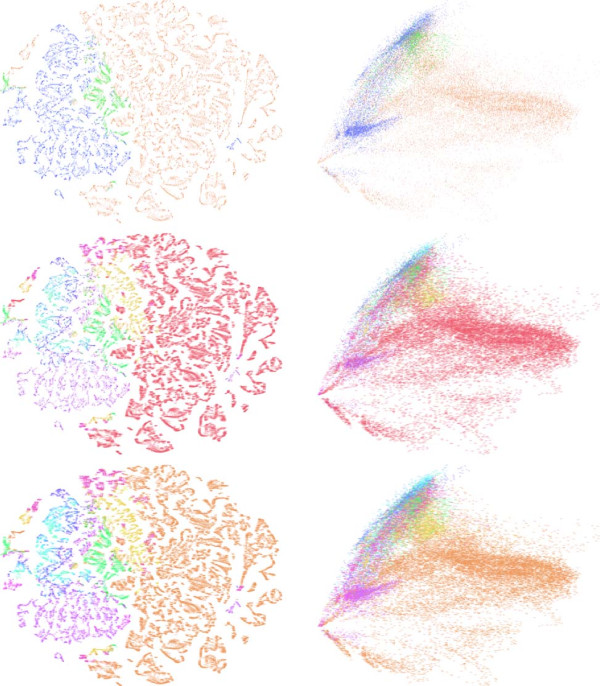
Figure 5.
Visualization of the Allen Developing Mouse Brain Atlas data for age P28 after projecting to 2-D space using t-SNE (left column) and PCA (right column) at multiple levels of the ontology. The three rows correspond to Levels 1, 3, and 5. Each point corresponds to a brain voxel, which is displayed using the structure abbreviation and color of its Reference Atlas annotation. Results for other ages are shown in the Additional file 1.

