Figure 9.

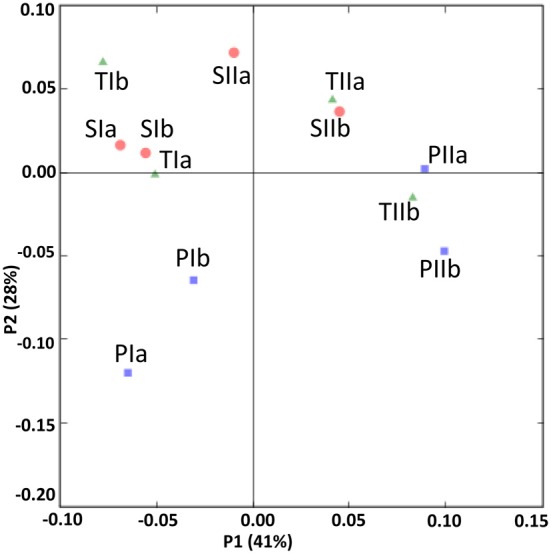
UniFrac analyses showing the PCA plots of SRB based on sequence abundance data in the P. australis (P), S. alterniflora (S) and transition (T) stands. The sample names are as described in Figure 1.

UniFrac analyses showing the PCA plots of SRB based on sequence abundance data in the P. australis (P), S. alterniflora (S) and transition (T) stands. The sample names are as described in Figure 1.