
Figure 2.
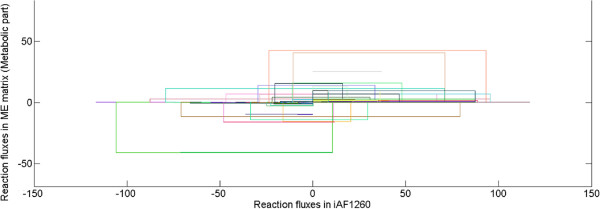
Flux variability analysis of the E. coli Metabolic-Expression model. Minimum and maximum flux for iAF1260 (which only accounts for metabolic reactions) versus the minimum and maximum flux for the Metabolic-Expression model. Each colored box corresponds to a different reaction in metabolism. The boxes are always longer on the axis for the metabolic model (iAF1260) than on the axis for the Metabolic-Expression model. This demonstrates that increasing the comprehensiveness of the model toward whole cell modeling leads to a substantial shrinkage of the steady state solution space. (Fluxes are plotted in ).