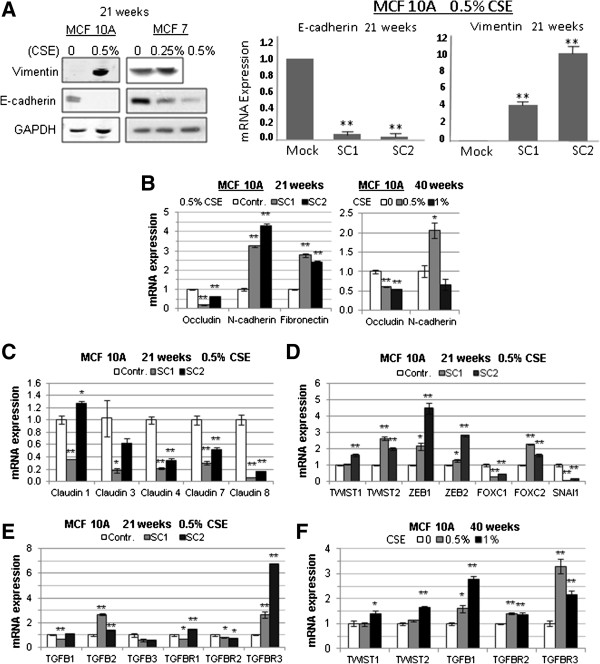
Figure 5.

Exposure of mammary epithelial cells to CSE leads to gene expression changes indicative of EMT. (A, left panel) Western Blot showing upregulation of Vimentin and downregulation of E-cadherin in MCF10A and MCF7 cells exposed to CSE for 21 weeks. (A, right panel) qRT PCR analysis showing downregulation of e-cadherin mRNA and upregulation of Vimentin mRNA in two MCF10A subclones after 21 weeks of exposure to 0.5% CSE. (B) qRT PCR analysis showing downregulation of occludin and upregulation of N-cadherin and fibronectin in two MCF10A subclones at 21 and 40 weeks of exposure. (C-F) qRT PCR analysis of EMT genes in MCF 10A mammary epithelial cells exposed to 0.5% CSE for 21 weeks (clones SC1 and SC2) or 0.5-1.0% CSE for 40 weeks (without subcloning). Data in bar graphs are mean ± standard deviation of 3 replicates; *P<0.01, **P<0.001.
