
Figure 1.
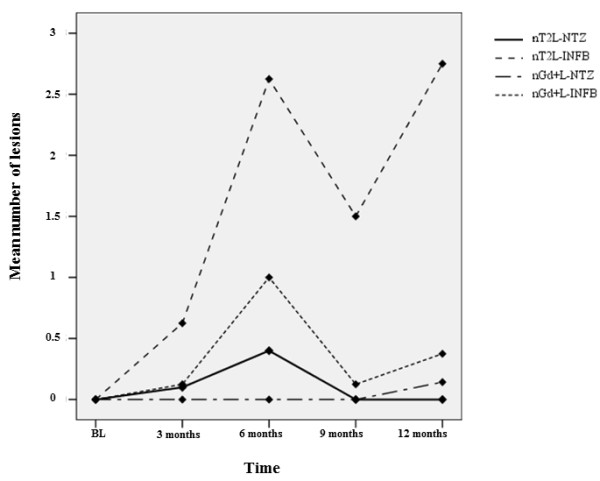
Mean number of new T2 lesions (nT2L) and gadolinium enhancing lesions (Gd+L) per patient at baseline and at month 3, 6, 9 and 12 of study (statistical analysis was performed with non parametric tests and reported in Results and Table 2 ).
Official websites use .gov
A
.gov website belongs to an official
government organization in the United States.
Secure .gov websites use HTTPS
A lock (
) or https:// means you've safely
connected to the .gov website. Share sensitive
information only on official, secure websites.
Mean number of new T2 lesions (nT2L) and gadolinium enhancing lesions (Gd+L) per patient at baseline and at month 3, 6, 9 and 12 of study (statistical analysis was performed with non parametric tests and reported in Results and Table 2 ).