Figure 2.

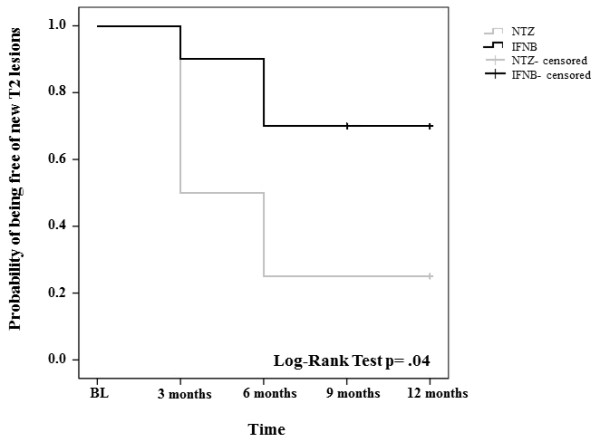
Kaplan Meier survival curves representing the probability of being free of nT2L lesions throughout the study period under de-escalation therapy with INFB or continued NTZ.

Kaplan Meier survival curves representing the probability of being free of nT2L lesions throughout the study period under de-escalation therapy with INFB or continued NTZ.