Figure 3c:

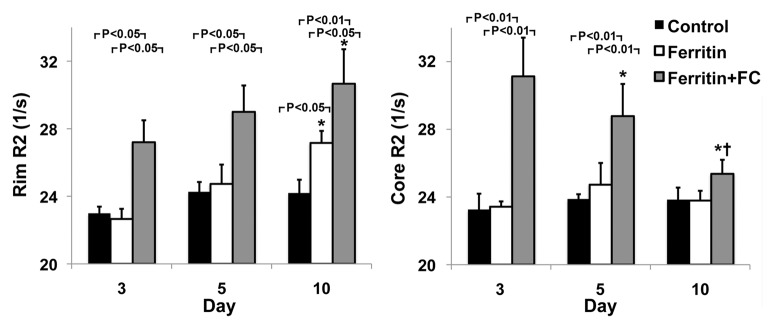
R2 mapping of tumors reveals core-to-rim migration of CV1-FHC fibroblasts. (a) Representative spin-echo coronal images of tumors (red arrows) acquired 3 days after coinjection of cancer cells and CV1 (control), CV1-FHC (ferritin), or CV1-FHC-FC (ferritin + FC) fibroblasts. Images of control and FHC group mice showed similar signal intensities at each echo time (15.4 msec and 38.5 msec). Images of FHC-FC group mice showed diffuse signal hypointensity at increasing echo times. (b) R2 mapping show similar tumor relaxation properties in control and FHC tumors 3 days after tumor initiation, and significantly heightened R2 in FHC-FC tumors. On day 10, R2 mapping showed migration of CV1-FHC cells to rims of tumors in FHC-FC group mice. In FHC tumors, heightened R2 was also observed along tumor rim. (c) Mean regional R2 showed core-to-rim migration in FHC-FC tumors. Time-dependent increase in R2 of rim was also observed in FHC tumors, but no change was seen in core. * = P < 05 vs day 3, † = P < .05 vs day 5.
