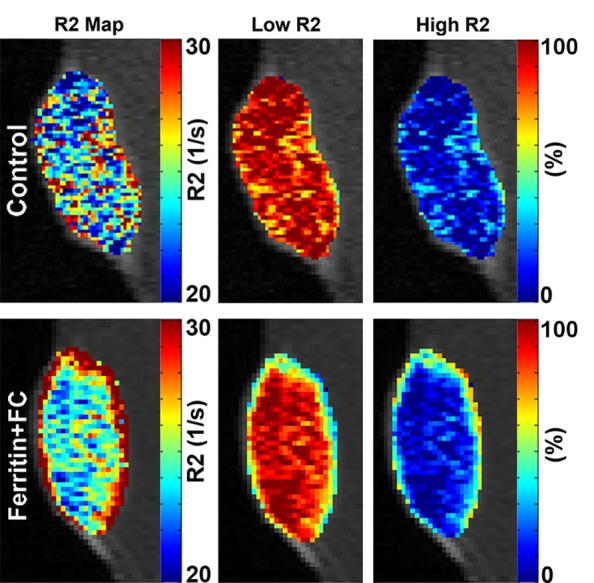
Figure 6a:

(a) Representative R2 maps generated by using monoexponential relaxation function show heightened R2 along rim of FHC-FC tumor. Tumor relaxation was modeled by using weighted biexponential function, where high R2 component represents CV1-FHC cells and low R2 component represents remaining tumor tissue. By fitting tumor relaxation waveforms for weights of each component, relative fraction of CV1-FHC cells and remaining tumor cells can be quantified as represented on high and low R2 fraction maps, respectively. (b) Mean CV1-FHC fraction (high R2 fraction) in coinjection studies shows core-to-rim migration of CV1-FHC in FHC-FC tumors. CV1-FHC fraction rose rapidly from day 3 to day 10 (at day 5, rim and core were identical) at rim of FHC-FC tumors, and fell rapidly during same period at core. * = P < .05 vs control, † = P < .05 vs core, ‡ = P < .05 vs day 5, § = P < .05 vs day 3. (c) Measurement of CV1-FHC fraction in recruitment studies revealed immediate recruitment of CV1-FHC cells to tumor rim, with continued accumulation of CV1-FHC cells up to 7 days after remote injection. * = P < .05 vs control, † = P < .05 vs core, ‡ = P < .05 vs day 0, § = P < .05 vs day 2, # = P < .05 vs day 4.
