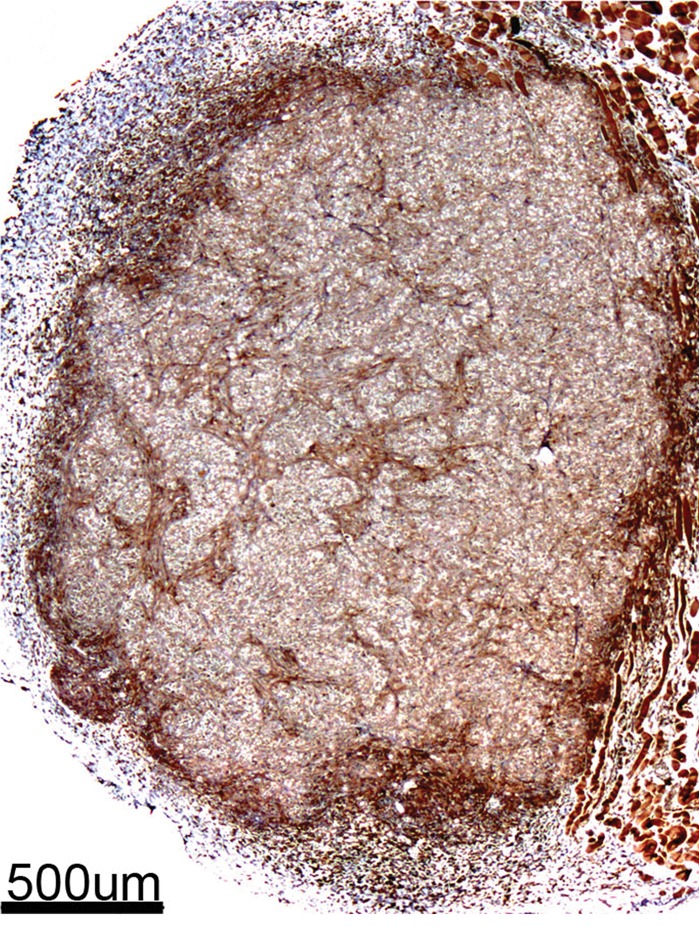
Figure 7b:

Immunohistochemical staining of isolated tissue sections from FHC-FC tumors at (a) day 10 (coinjection) and (b) day 13 (recruitment) shows significant recruitment of CV1-FHC cells to tumor rim in both models. (c) DAB staining at rim and core of control tumors was minimal, revealing more hematoxylin and eosin staining. Limited nonspecific staining of skin, muscle, and fat around tumor was seen in both FHC-FC and control tumors. (d) Representative immunofluorescent staining of FHC-FC tumors shows CV1-FHC cells in red and nuclei of all cells in blue. (e) Higher magnification of immunofluorescent images from region in rim reveals labeling of individual cells and enables quantitative measurement of CV1-FHC cell fraction in both tumor models. (f) Mean CV1-FHC cell fraction was similar at rims of FHC-FC tumors in coinjection and recruitment models (P = .6). At core, CV1-FHC cell fraction trended higher in coinjection than in recruitment tumors (P = .06). In both models, CV1-FHC cell fraction was significantly higher at rim than in core * = P < .01 vs rim, um = micrometer.
