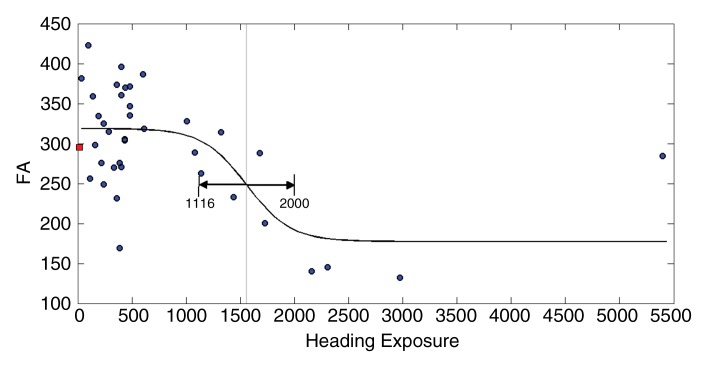
Figure 2c:
(a–c) Inverse logit fits for mean FA values from each of the three ROIs (Fig 1) and (d) for memory versus heading exposure. Observed values and the fitted inverse logit function are expressed in blue circles and black curves, respectively. Light-gray line = estimated threshold (β2) and its 95% confidence interval = black line with double-sided arrows, red box = mean FA and memory performance values.

