
Figure 3.
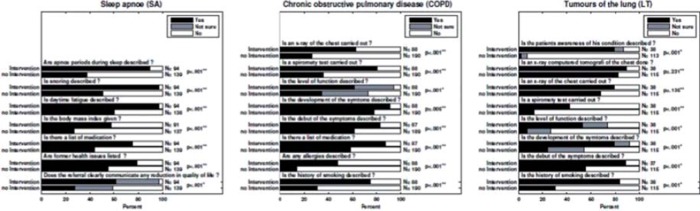
Percentage of the answers to questions 3–10 for sleep apnoea, chronic obstructive pulmonary disease, and lung tumours in the intervention and the non-intervention group in numbers and percentages with p-values of the chi-squared test (*) or Fisher's exact test (**).