
Figure 3.
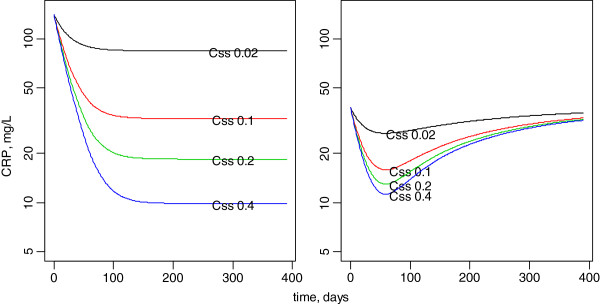
Model-predicted effect of anakinra on the C-reactive concentration-time courses assuming 0.02 to 0.40 mg/L mean steady-state anakinra concentrations in the 2 subgroups of patients. Left, high base level with large CRP decrease. right, moderate base CRP with initial decrease followed by a re-increase in CRP concentrations.