Figure 3.
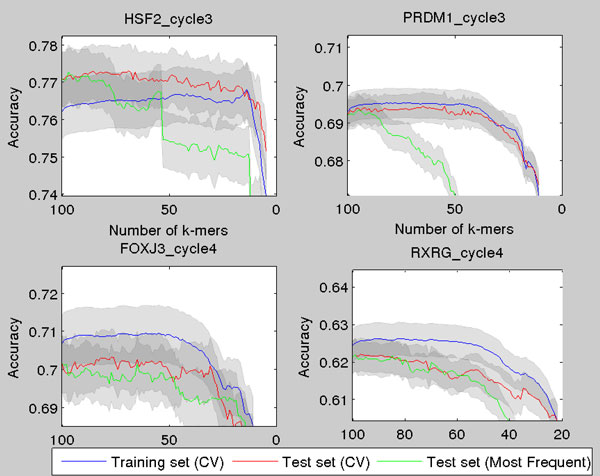
Illustration of classification accuracy using the CV-scheme for four proteins. The test set classification accuracy as a function of number of k-mers, when the k-mers are chosen with the CV-scheme. The CV is started from 100 most frequent k-mers. The 95% normal approximation confidence intervals are plotted around the curves.

