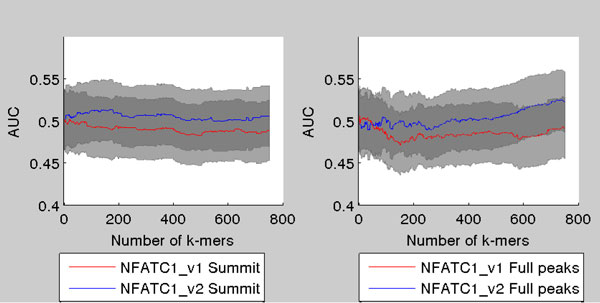
Figure 8.

AUC as a function of number of k-mers in the model for two NFATC1 ChIP-seq samples. (left) AUCs when the true binding sites are taken to be within 100 nucleotides around the summit of the ChIP-seq peak. (right) The same as (left) except each binding site is taken to be the whole ChIP-seq peak region. The 95% Mann-Whitney confidence intervals plotted around the curves.
