
Figure 9.
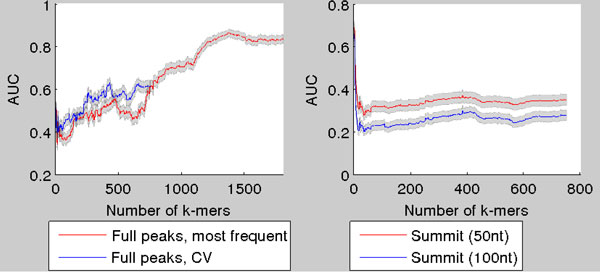
AUC as a function of number of k-mers in the model for GATA1 ChIP-seq samples. AUC as a function of number of k-mers for GATA1, when k-mers are selected with the CV-scheme. In left figure (red) the AUC is plotted when using the most frequent k-mers. In right figure the AUC is calculated when only the centers of the ChIP-seq peaks are used. The 95% Mann-Whitney confidence intervals plotted around the curves.