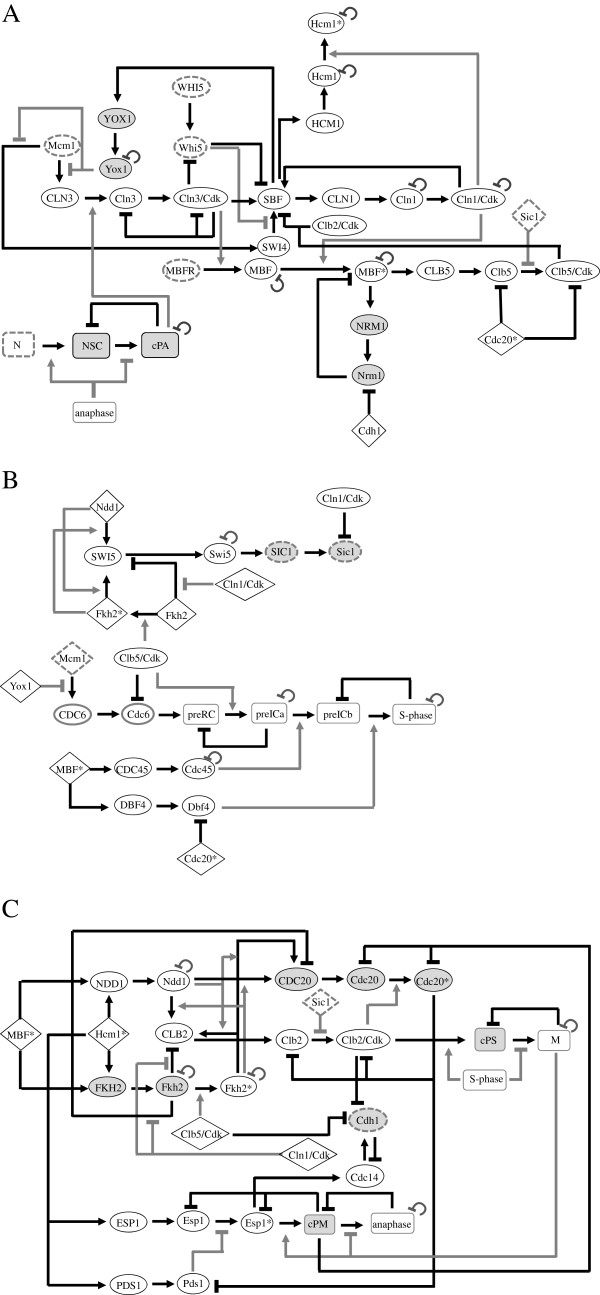
Figure 1.
A Schematic view of the cell-cycle in S. cerevisiae. A. G1 and G1/S phases, B. S-phase, and C. G2 to anaphase. For simplicity we used this code to distinguish between the following: positive regulators – white ovals, negative regulators – gray ovals. Oval shapes with a dashed outline represent nodes with a constitutive state of 9 or whose initial state was 9. White diamonds represent regulators whose regulation appears in another part of the figure. Rectangles represent cellular events (white) and checkpoints (gray). Positive edges – arrows, negative edges – lines with bars, dependency edges – gray arrows from a node to an edge. Self-edges represent negative auto-regulation. Details on the construction of the network are given in Methods.

