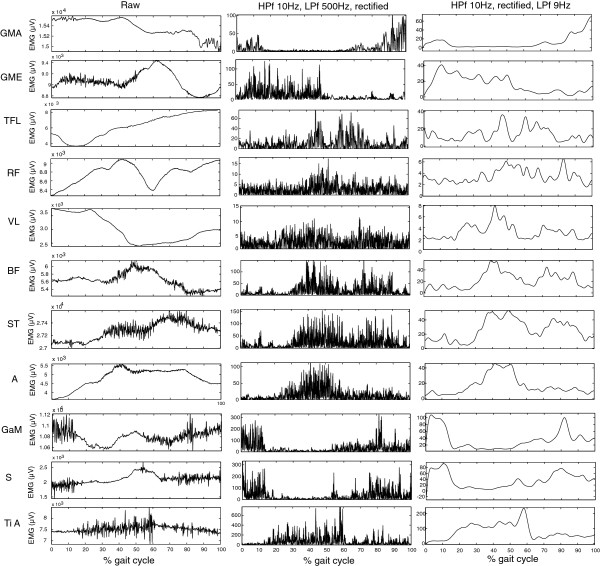
Figure 1.
Raw EMG data. An example of filtered activity of all upper and lower leg muscles, of one subject during one trial. The row on the left shows the raw data of the trial during one gait cycle. The middle row shows the high pass filtered (HPf), rectified and low-pass filtered (LPf) data of the same trial and the right hand row shows the linear envelope HPf at 10Hz, rectified and LPf at 9Hz.

