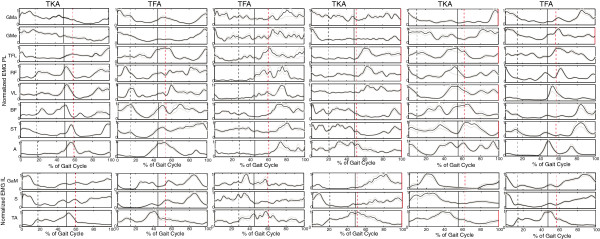
Figure 4.

Ensemble averages amputees. The ensemble averages of each of the amputees averaged over all trails (20) for each of the measured muscles. The amputee data is deliberately not placed in the order of amputees seen in Table 1, to prevent matching of data and subjects. The black dashed line represents initial swing of the IL, the black solid line initial contact of the IL and the red dashed line initial swing of the PL. (PL = prosthetic limb, IL = intact limb).
