
Figure 1.
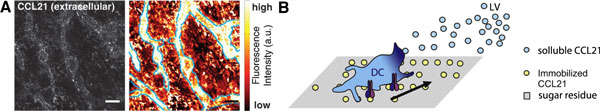
Haptotaxis: Data and schematic description of the process. Haptotaxis: Data and schematic description of the process. (A) Fluorescence staining image taken from [7], which shows the Z-stack projection of non-permeabilized ear dermis stained for CCL21. Left image is the maximum intensity projection and the right image shows same staining as color-coded average projection. Lymphoid vessel boundaries are indicated by the blue dotted line (scale bars: 100µm). (B) Schematic of the dendritic haptotaxis process adapted from [6]. Dendritic cells move along a gradient of immobilized CCL21 towards the lymphatic vessels.