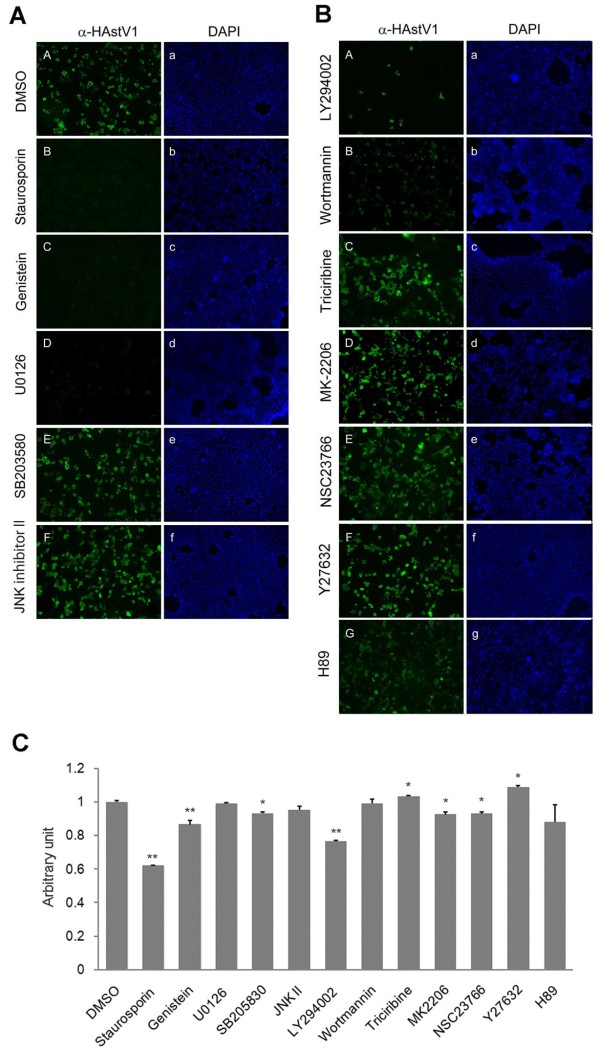
Figure 1.
Effects of kinase inhibitors on capsid protein expression following HAstV1 infection. (A) Caco-2 cells were infected with HAstV1 (MOI = 0.22) in the presence of solvent alone (DMSO, panels A and a), staurosporine (4 μM; B and b), genistein (10 μM; C and c), U0126 (20 μM; D and d), SB 203580 (50 μM; E and e), or JNK inhibitor II (50 μM; F and f). The cells were fixed at 24 h post-infection (hpi), and then HAstV capsid protein was detected by immunofluorescence. Each pair of panels shows, for the same field of cells, the staining patterns for the viral capsid protein (anti-HAstV, A through F) and for cellular DNA (DAPI, a through f). (B) Caco-2 cells were infected with HAstV1 in the presence of various kinase inhibitors, LY294002 (50 μM; panels A and a), wortmannin (1 μM; B and b), Triciribine, (10 μM; C and c), MK-2206 (10 μM; D and d), NSC23766 (50 μM; E and e), Y27632 (50 μM; F and f), and H89 (10 μM; G and g). Each pair of panels shows, for the same field of cells, the staining patterns for the viral capsid protein (A through G) and for cellular DNA (a through g). (C) Viability of Caco-2 cells infected with HAstV1 in the presence of designated drugs was examined by colorimetric assay using WST-1 reagent (Takara). The absorbance of the cell culture medium was measured at 450 nm versus a 650-nm reference. The vertical axis indicates arbitrary unit divided by the mean value of a solvent-only (DMSO) control sample. The mean value obtained using three of each sample is presented as bar graph, with the standard deviation indicated as error bar. Statistical significance, compared with the solvent control (DMSO) is indicated (*P < 0.05; **P < 0.01).

