Figure 2.
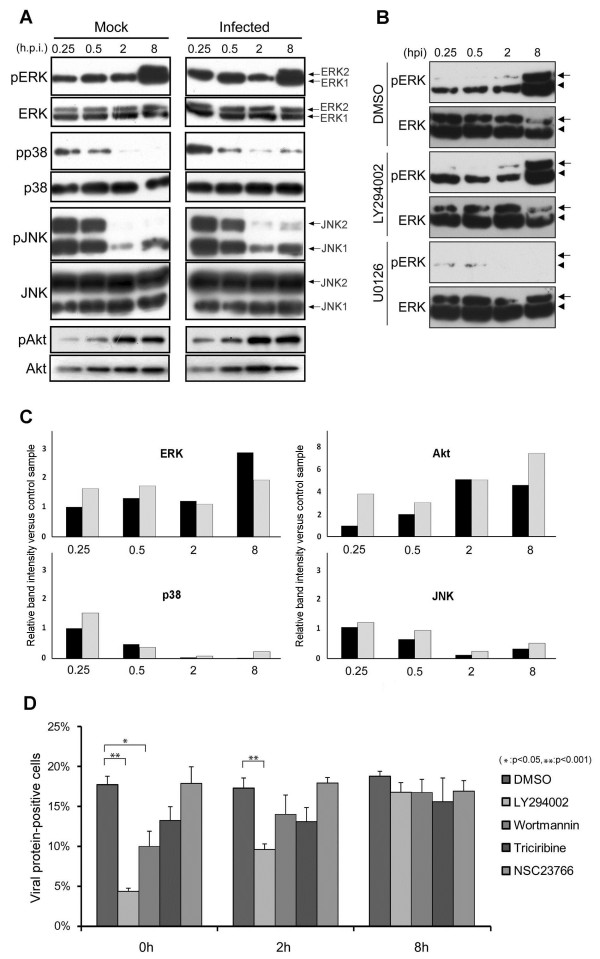
Importance of timing of kinase inhibition during HAstV1 infection. (A)Time course of activation of MAPKs and Akt. Lysate was prepared from either mock-infected (Mock) or HAstV1-infected (Infected) Caco-2 cells at designated time points. The lysates were subjected to Western blot to detect either total kinases (ERK, p38, JNK, and Akt) or their phosphorylated forms [(pERK, pp38, pJNK, and pAkt) MAPKs and Akt]. The two bands in the “ERK” and “pERK” panels represent ERK1 (44 kDa) and ERK2 (42 kDa), respectively. The two bands in “JNK” and “pJNK” panels represent JNK1 (54 kDa) and JNK2 (46 kDa), respectively. (B)Effect of inhibitors on kinase activation. Lysates prepared at designated time points from HAstV1-infected Caco-2 cells in the presence of solvent alone (DMSO), LY294002, or U0126 were subjected to Western blot for either total ERK (ERK) or its phosphorylated form (pERK). ERK1 and 2 bands are indicated by an arrowhead and an arrow, respectively. (C)Quantitative presentation of the Western blot signal shown in A. Digital images of the bands were quantitated using ImageJ. The vertical line indicates the relative value of the signal intensity divided by the value of the band for each mock-infected sample, at 0.25 hpi, in each experimental group. The black and gray bars represent values for the mock- and HAstV1-infected sample, respectively. Note that, due to large differences, the scale of the vertical bar representing “Akt” differs from that of others. (D)Effects of inhibitors on capsid protein expression. Caco-2 cells were infected and examined by immunofluorescence analysis as in Figure 1, except that solvent alone or inhibitors were added at indicated time points and maintained until fixing at 24 hpi. For each time point, the proportions of cells positive for capsid protein expression were examined statistically as described in Methods. (*P < 0.05; **P < 0.001).

