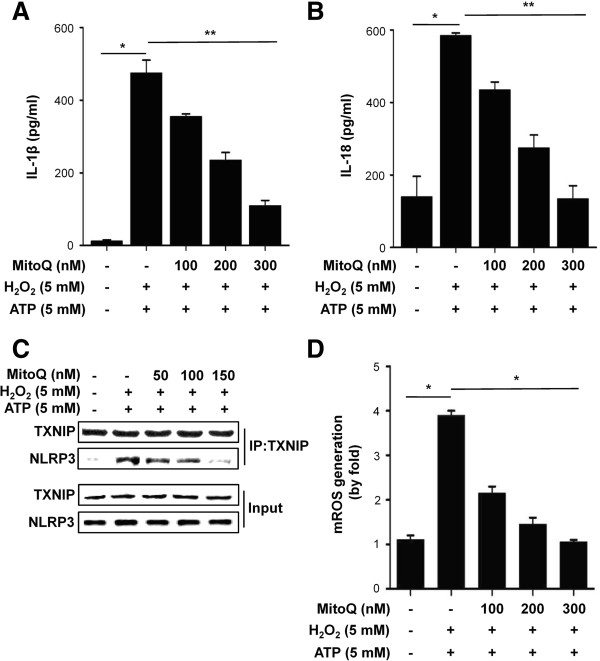
Figure 6.
Effect of MitoQ on human THP-1 cells. (A) IL-1 beta and (B) IL-18 release in response to H2O2 or ATP were analyzed by ELISA. Results are expressed as mean ±SE. n=5,*P<0.001. (C) The interaction between TXNIP and NLRP3 was examined by co-IP and western blotting analysis. (D) mtROS production in THP-1 cells. Cells were differentiated for 24 hours with 100 nM phorbol 12-myristate 13-acetate. Results are expressed as mean ±SE. *P<0.001.

