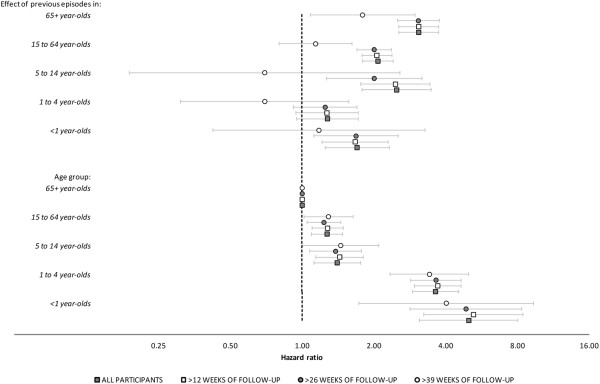
Figure 1.

Sensitivity analysis investigating the influence of varying lengths of follow-up on model-estimated hazard ratios and 95% CIs for the main effects of age and the interaction between age group and a linear effect of previous episodes. Dark squares: all cohort participants; Light squares: participants with >12 weeks of follow-up; Dark circles: participants with >26 weeks of follow-up; Light circles: participants with >39 weeks of follow-up.
