Figure 4.
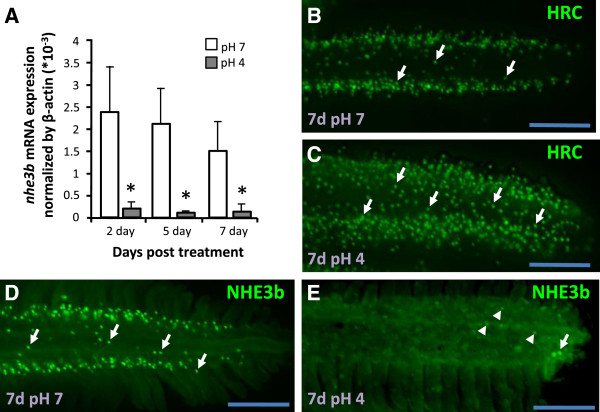
Down-regulation of nhe3b in gills under acid stress. (A): Expression of nhe3b mRNA in gills treated with control pH7 FW (white bars) or acidic pH4 FW (gray bars) for the indicated days. Mean ± SD (n = 6). *p < 0.05 (Student’s t-test). (B-E): Immunostaining images of H+-ATPase (H-pump) and NHE3b in gills from adult zebrafish maintained in pH7 FW (B, D) or pH4 FW (C, E) for 7 d. Arrow, NCC or NHE3b signal; arrow head, weaker NHE3b signal. Scale bar = 100 μm.

