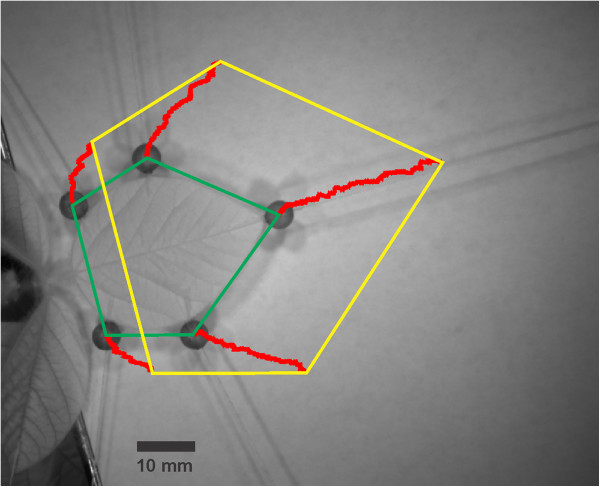
Figure 5.
Illustration of the growth of a soybean leaf in a climate chamber. The five red lines are overlaid to the first image of a sequence. They indicate the path of the center of every single black bead tracked over a period of 86.5 hours with Martrack Leaf. The green pentagon shows the leaf area at beginning of the measurement whereas the yellow pentagon denotes the area at the end of the measurement.

