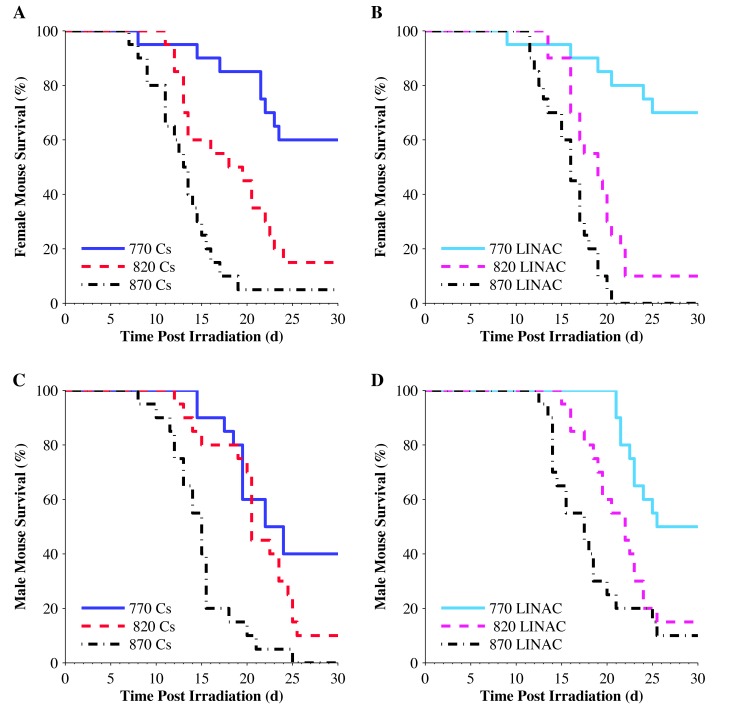
Figure 3.
Kaplan–Meier survival curves for all mice (n = 20 mice for each combination of sex, dose, and radiation source). (A) Survival of female mice after TBI doses of 770, 820, or 870 cGy from a Cs137 source. (B) Survival of female mice after TBI doses of 770, 820, or 870 cGy from a LINAC source. (C) Survival of male mice after TBI doses of 770, 820, or 870 cGy from a Cs137 source. (D) Survival of male mice after TBI doses of 770, 820, or 870 cGy from a LINAC source.

