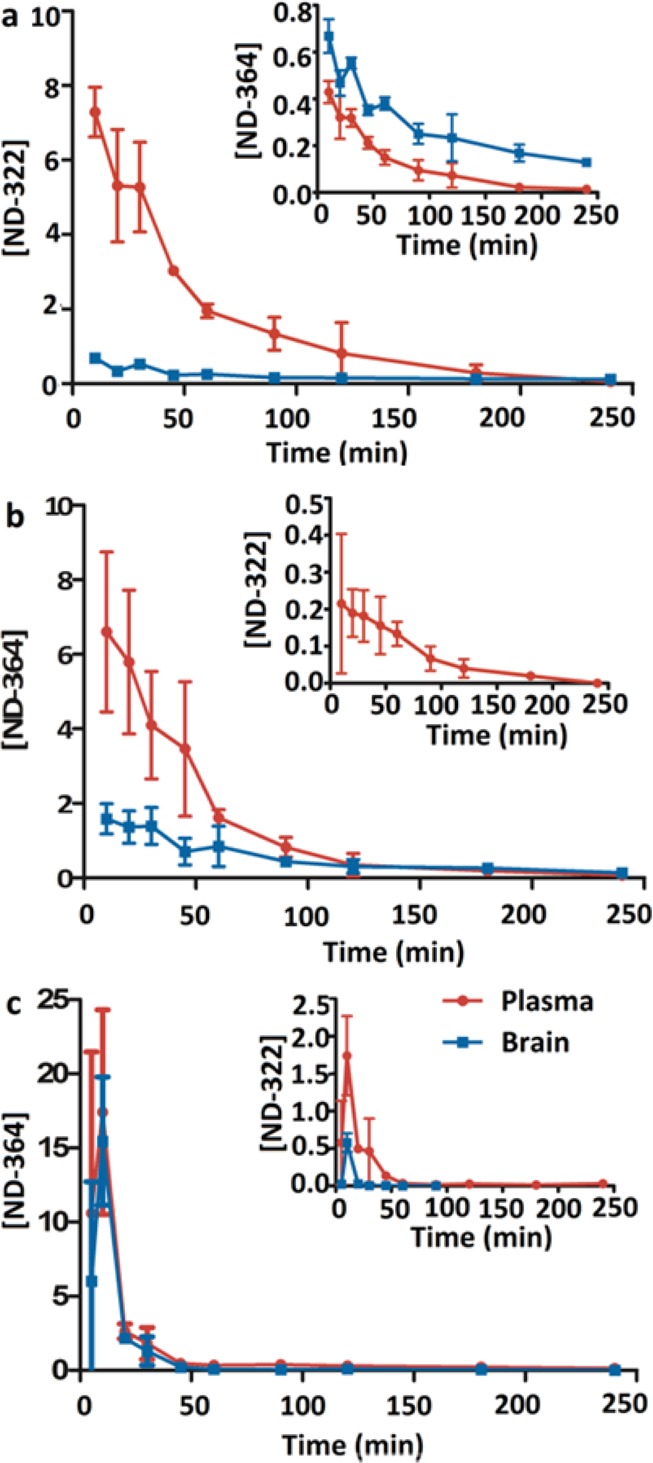
Figure 3.

Brain and plasma concentration–time curves after (a) single sc dose administration of ND-322, (b) single sc dose administration of ND-364, and (c) single ip dose administration of ND-364 to mice. Doses of ND-322 and ND-364 were equimolar. Concentrations are given in pmol/mg tissue for brain and in μM for plasma.
