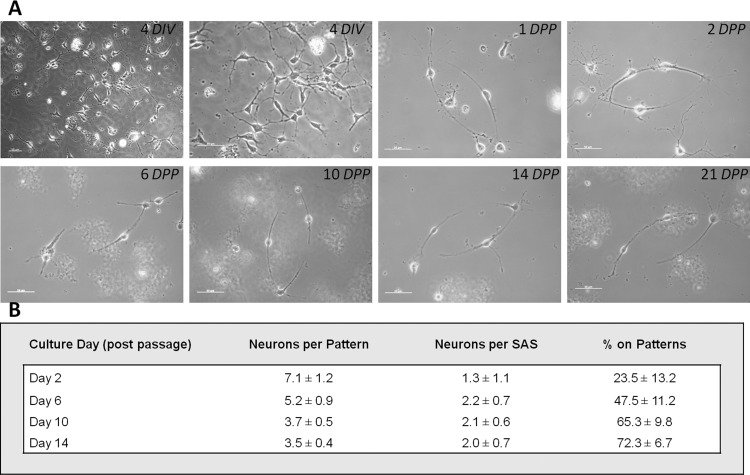
Figure 3.
(A) Time-course pictures of neurons on culture after 4 DIV, 1 DPP, 2 DPP, 6 DPP, 10 DPP, 14 DPP, and 21 DPP. Scale bar = 50 μm. (B) Neuronal conformity to PEG-DETA bidirectional polarity pattern(s). Attachment and regeneration of neurons on the bidirectional polarity patterns was quantified by counting the number of neurons (1) attached to any part of the two-cell circuit pattern and (2) specifically to the SASs. The percentage of neurons attached to the DETA patterns versus the PEG background was quantified (n > 15, where n is the number of patterned coverslips evaluated).

