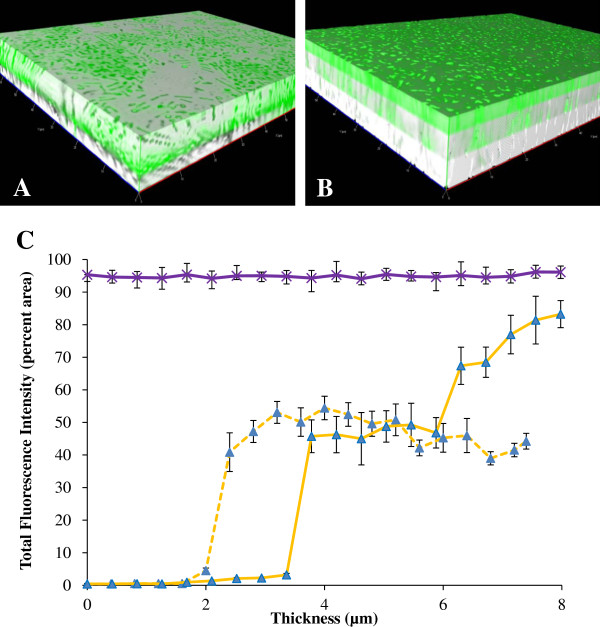
Figure 3.
Spatial gene expression of flhD in the parent strain. (A) and (B) are the 3D images constructed from the z-stacked images (bright field and fluorescence) at 12 hours (A) and 51 hours (B), using BP1470 (AJW678 pPS71). (C) is the quantitative representation of the spatial gene expression of flhD at 12 hours (dashed yellow line) and 51 hours (solid yellow line) of biofilm formation. The purple line is the spatial expression profile from the aceK::gfp fusion at 34 h.

