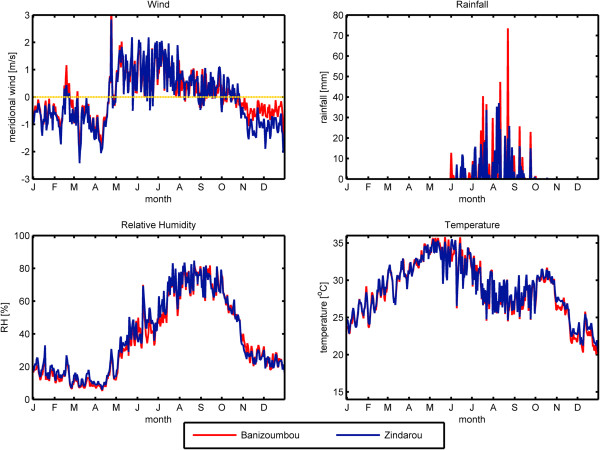
Figure 1.

Climate in Banizoumbou and Zindarou. Ground observations of daily average meridional wind speed, daily total rainfall, and daily averages of relative humidity and temperature are shown for Banizoumbou (red) and Zindarou (blue) for the year 2006. Postive values (above the yellow line) indicate wind blowing from the south while negative values (below the yellow line) indicate wind from the north.
