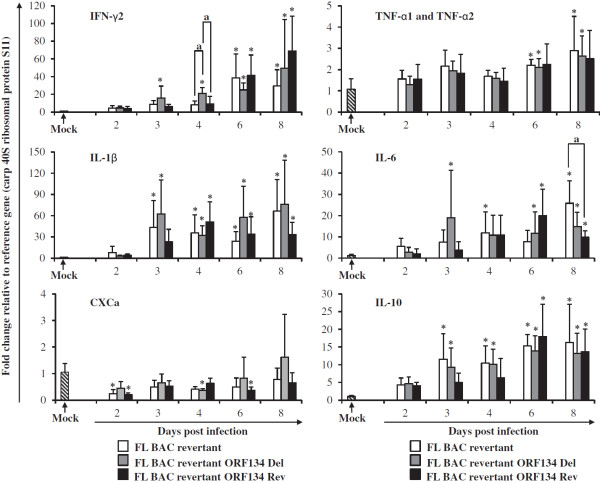
Figure 11.
RT-qPCR analysis of cytokines. Kinetics of gene expression was measured in the spleen of mock-infected fish and fish infected with CyHV-3 ORF134 recombinants (see legend of Figure 10). Gene expression was normalized relative to the expression of the S11 protein of the 40S ribosomal subunit. Data are presented as mean ± SD (n = 6). Symbol (*) indicates statistical differences (p ≤ 0.05) observed between infected and mock-infected fish. Symbol (a) indicates statistical differences (p ≤ 0.05) observed for a specific time point between groups of fish infected with different CyHV-3 recombinants.

