
Figure 2.
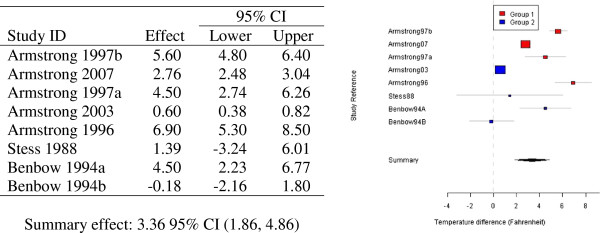
Random effects modelling of eight mean temperature differences in the “Effect” column (°F) and associated forest plot of observed mean temperature differences (°F, 95% CI) for groups “one” and “two”.
Official websites use .gov
A
.gov website belongs to an official
government organization in the United States.
Secure .gov websites use HTTPS
A lock (
) or https:// means you've safely
connected to the .gov website. Share sensitive
information only on official, secure websites.
Random effects modelling of eight mean temperature differences in the “Effect” column (°F) and associated forest plot of observed mean temperature differences (°F, 95% CI) for groups “one” and “two”.