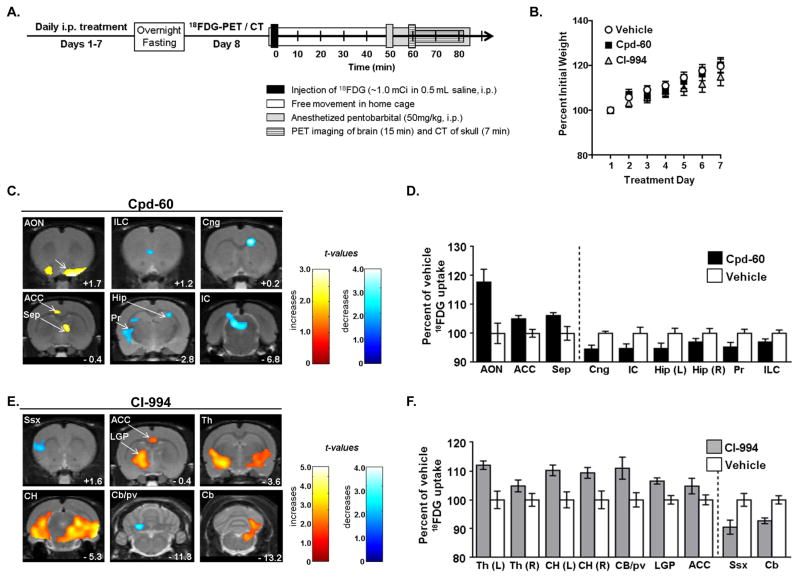
Figure 2.
A. Chronic treatment schematic with timeline in days (left) and, on day-8, PET/CT imaging schematic with timeline in minutes (right). B. Daily treatment with Cpd-60 (22.5 mg/kg) or CI-994 (5 mg/kg) did not significantly affect rat weight over seven days compared to vehicle-treated controls (n=11–12/group). C. and E. Brain regions with significant changes in glucose uptake induced by chronic treatment with C. Cpd-60, an HDAC1,2 inhibitor or E. CI-994, an HDAC1,2,3 inhibitor. Brain structures abbreviated in upper left corner of each panel comprise significant increases (yellow/red t-value maps) and decreases (blue t-value maps) compared to vehicle treated controls (n=11–12/group). Anterior-Posterior distance from Bregma (mm) is indicated in lower right corner of each panel. D. and F. Histograms showing percent changes in local 18FDG uptake induced by treatment with Cpd-60 (D.) or CI-994 (F.) relative to controls. Changes were evaluated using ROI analysis of regions highlighted in C. and D. and including increases in 18FDG uptake (left of dashed lines) and decreases (right of dashed line).

