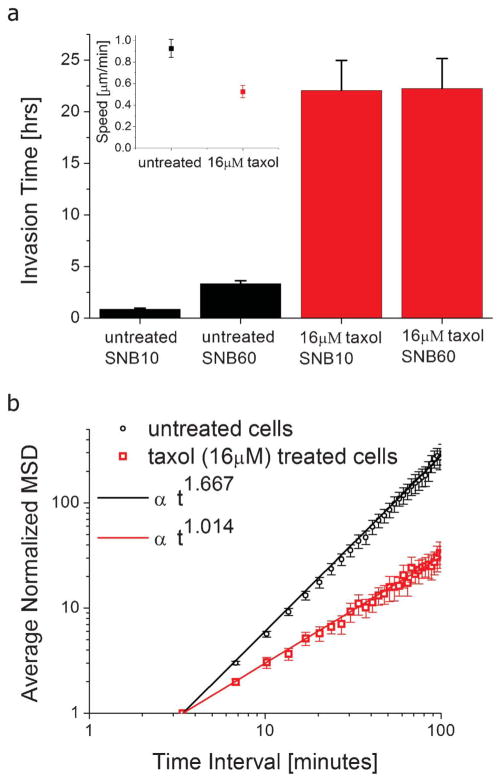
Fig. 4.
Effects of Microtubule Stabilization. a) Taxol-treated (16 μM) MDA-MB-231 cells take much longer to permeate across the subnucleus barriers than untreated MDA-MB-231 cells. The total invasion times are 0.86 h (n = 62 invasion events), 3.33 h (n = 20 invasion events), 22 h (n = 42 invasion events), 22 h (n = 31 invasion events), for untreated cells across SNB10, untreated cells across SNB60, taxol-treated cells across SNB10, and taxol-treated cells across SNB60, respectively. Many of the taxol-treated cells have yet to permeate through the subnucleus barrier by the end of the experiments, so the data represents a lower-bound measurement. Cells that have not permeated by the end of the experiments were only accounted for if they have spent at least 4 h at the barrier. This way we have disregarded arbitrarily short lower-bound measurements for data that was truncated too early (less than 4 h). Inset: the average speed of untreated (0.93 μm min−1, n = 12) and 16 μM taxol-treated (0.53 μm min−1, n = 10) MDA-MB-231 cells in the larger channel LC during a 3.4 min time interval. Error bars are s.e.m. b) Log-log plot of the average normalized mean-squared displacements (MSD) vs. time for untreated (black circles, n = 12 cells) and taxol-treated cells (red squares, n = 10 cells) in the larger channel LC. Normalization is with respect to the first data point (3.4 min time interval) of each cell. Error bars are s.e.m. A non-linear least squares fit to a power-law model shows a dependence of t1.667 (R2: 0.996, 95% confidence [1.66, 1.673]) and t1.014 (R2: 0.9829, 95% confidence [1.006, 1.022]) for untreated and taxol-treated MDA-MB-231 cells, respectively. For Brownian motion, MSD ∝ t.

